
MultiLayerMatrix: Visualizing Large Taxonomic Datasets
June 6th, 2016
Categories: Visual Analytics, Visual Informatics
Authors
Dang, T.N., Cui, H., Forbes, A.G.About
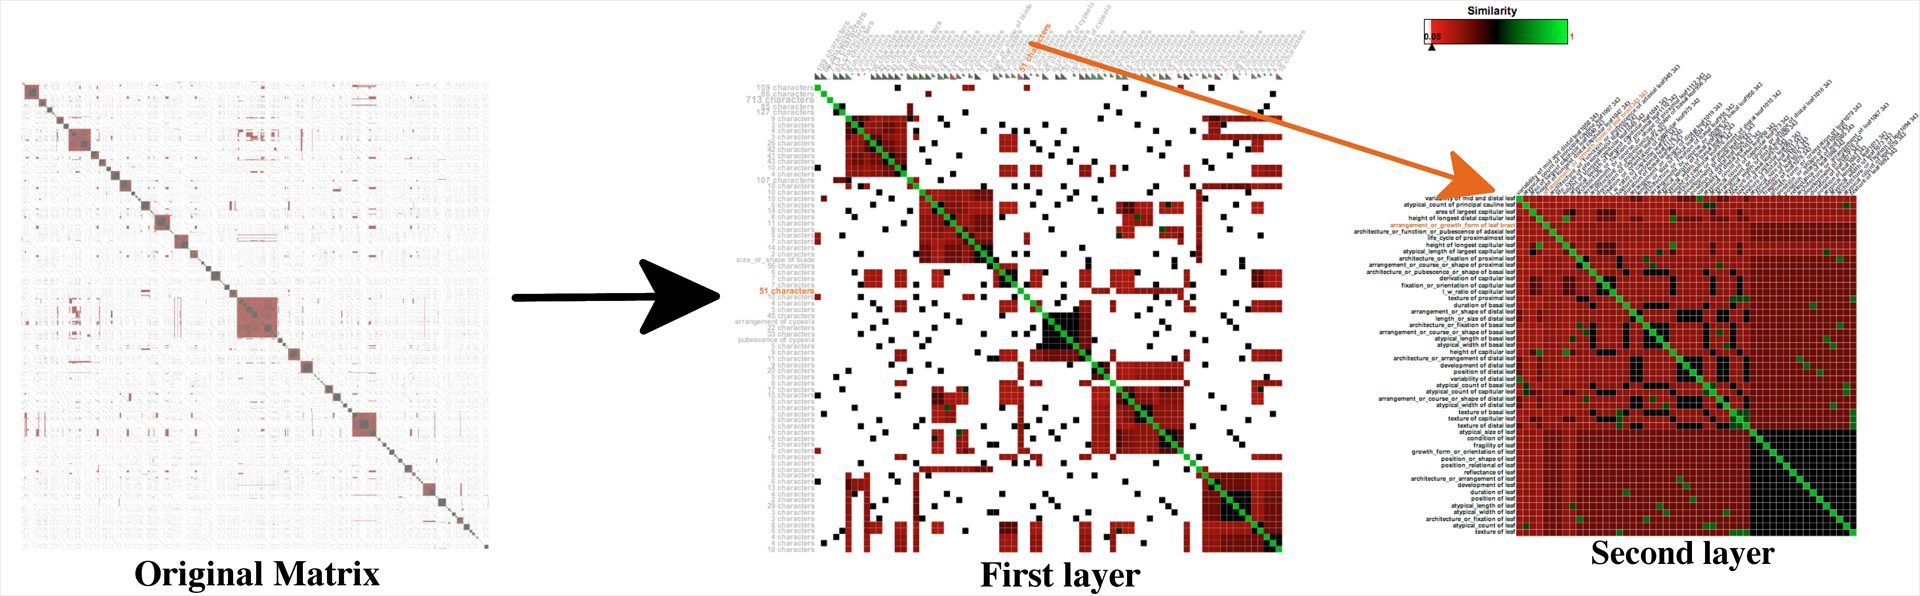
Adjacency matrices can be a useful way to visualize dense networks. However, they do not scale well as the network size increases due to limited screen space, especially when the number of rows and columns exceeds the pixel height and width of the screen. We introduce a new scalable technique, MultiLayerMatrix, to visualize very large matrices by breaking them into multiple layers. In our technique, the top layer shows the relationships between different groups of clustered data while each sub-layer shows the relationships between nodes in each group as needed. This process can be applied iteratively to create multiple sub-layers for very large datasets. We illustrate the usefulness of MultiLayerMatrix by applying it to a network representing similarity measures between 2,048 characters in the Asteraceae taxonomy, a rich dataset that describes characteristics of species of flowering plants.We also discuss the scalability of our technique by investigating its effectiveness on a large synthetic dataset with 20,000 columns by 20,000 rows.
Resources
URL
Citation
Dang, T.N., Cui, H., Forbes, A.G., MultiLayerMatrix: Visualizing Large Taxonomic Datasets, EuroVA: International Workshop on Visual Analytics (2016), Groningen, The Netherlands, June 6th, 2016. http://dx.doi.org/10.2312/eurova.20161125