
V-NeuroStack: 3-D time stacks for finding patterns in spontaneous activity of neurons in mouse brain slice
October 21st, 2019
Categories: Applications, Software, Visualization, Visual Analytics
Authors
Naik, A.G., Kenyon, R.V., Berger-Wolf. T., Ibrahim, B., LLano, D.A.About
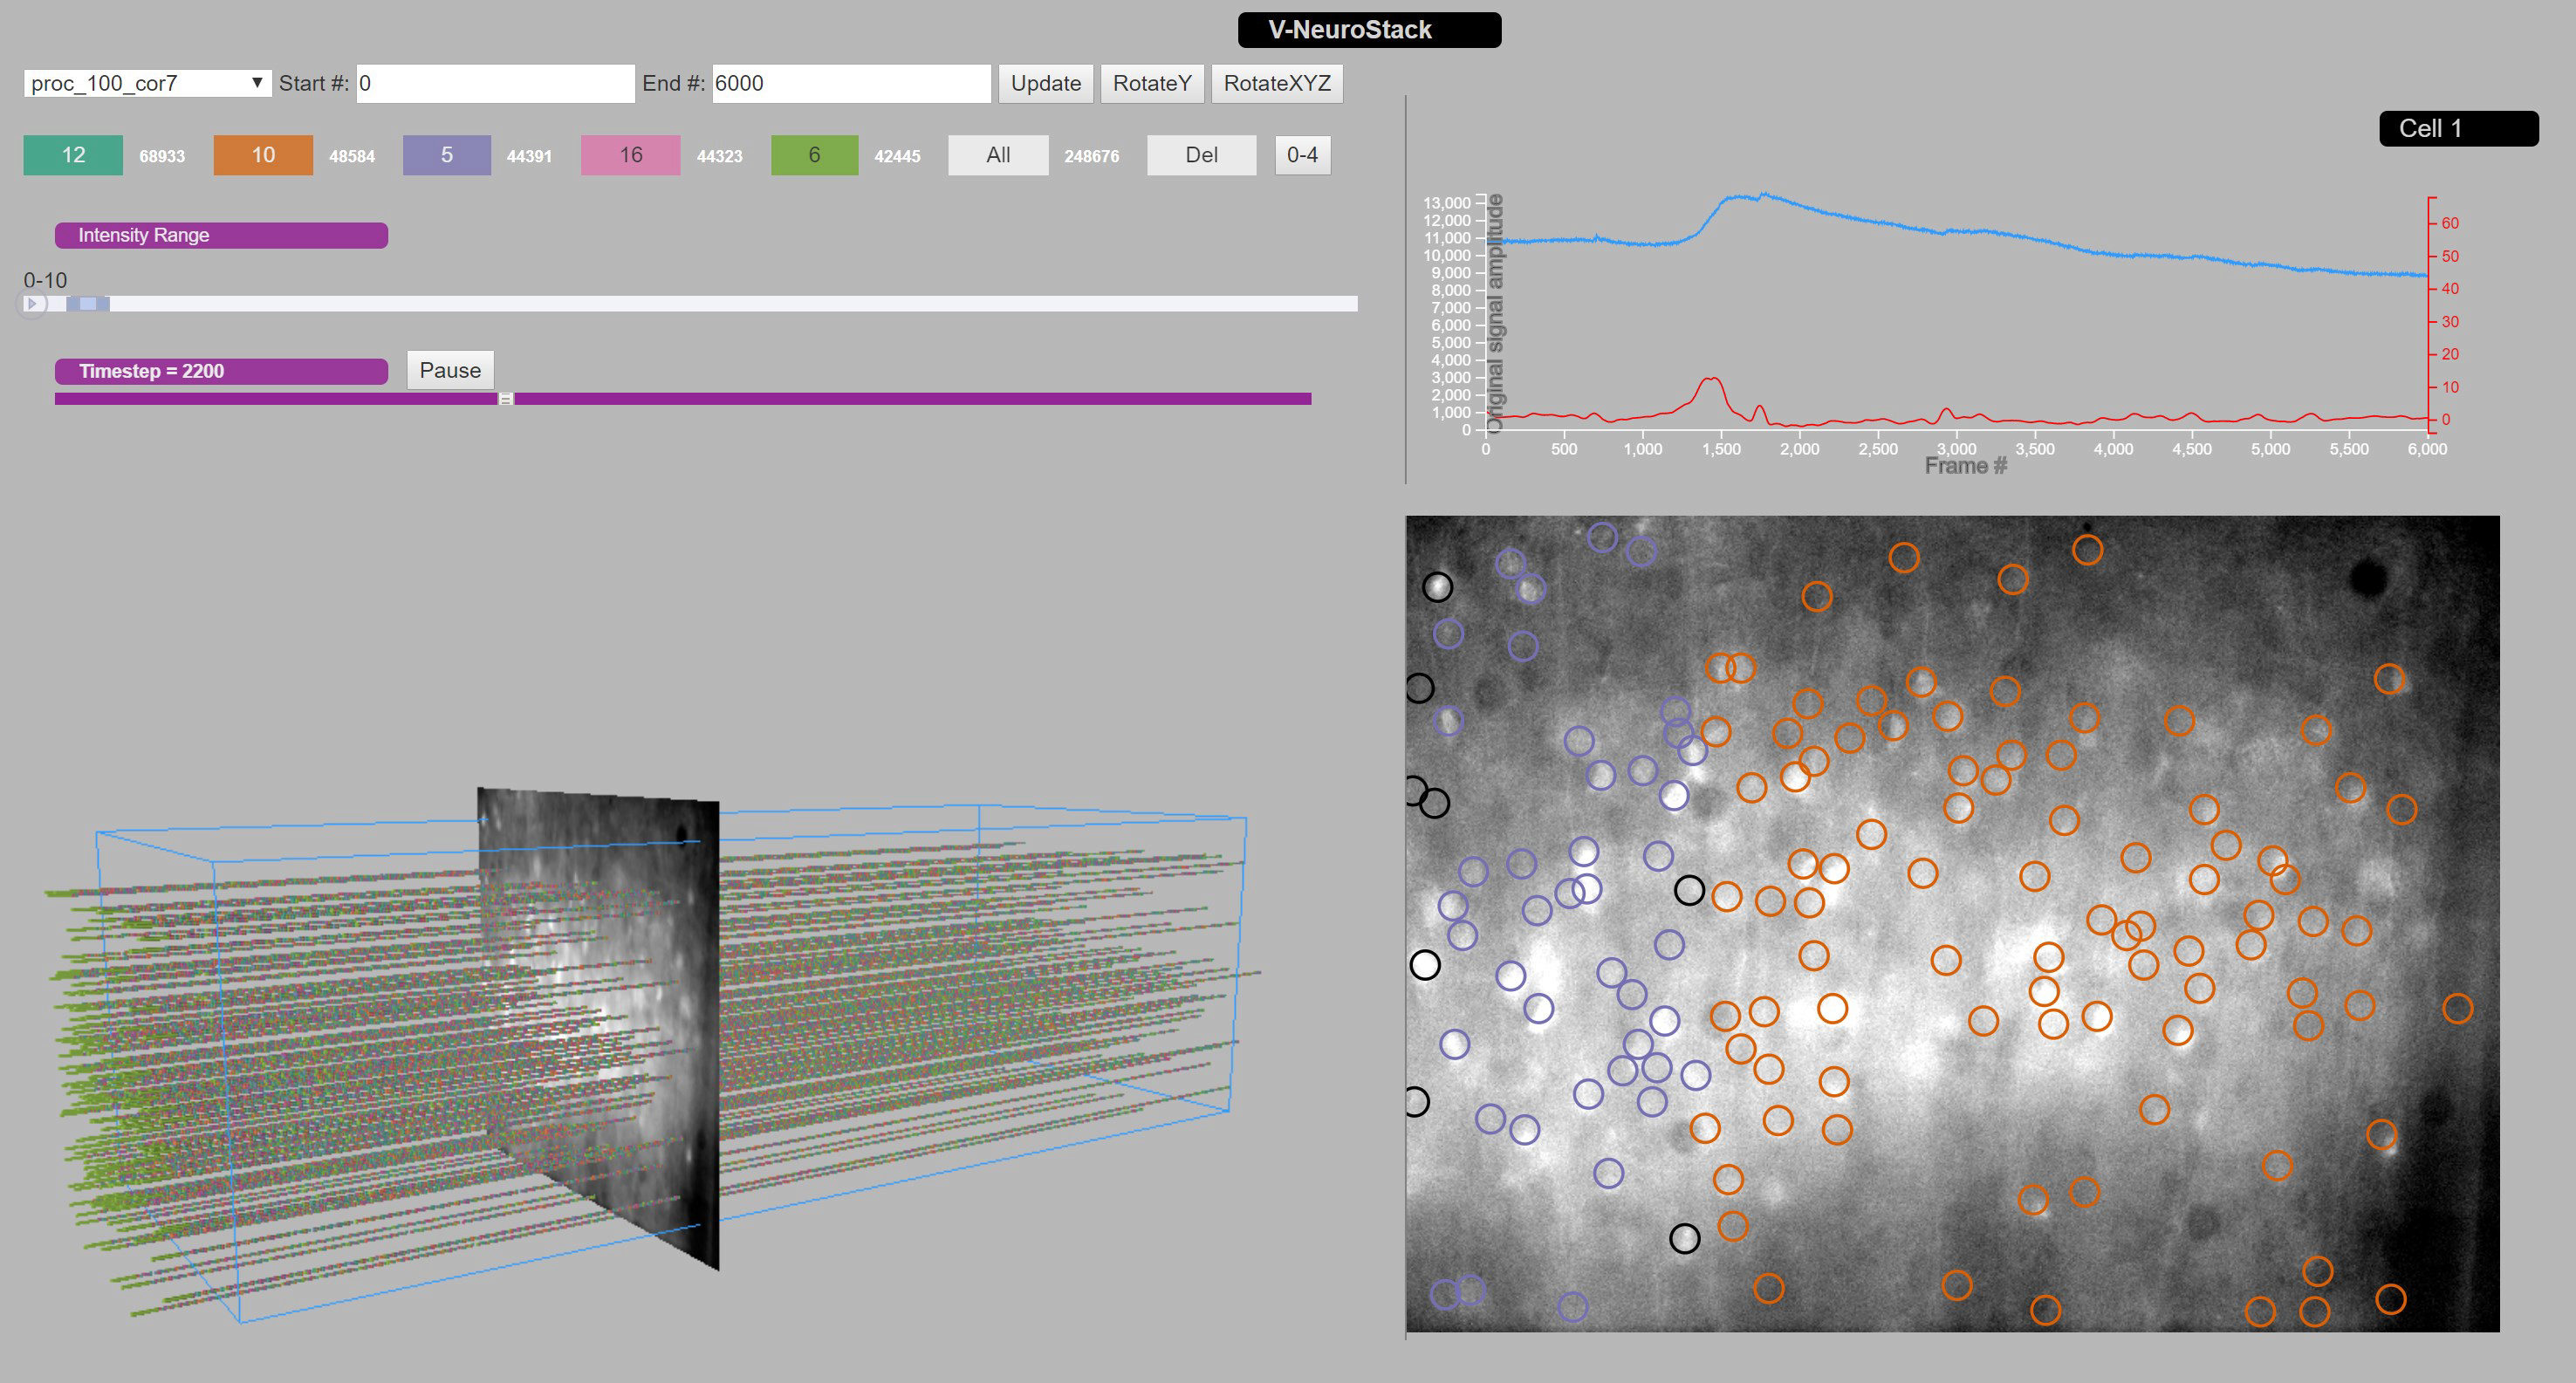
V-NeuroStack is a web application which uses 3-D time stack approach to identify patterns in the neuronal activity and to understand functional relationships between neurons. Our research group aims to understand the auditory corticothalamic activity in the mouse. We used GCaMP6s calcium imaging to capture spontaneous activity of cortical neurons. V-NeuroStack uses a point cloud to visualize the behavior of neurons during spontaneous activity while also having the capability to drill down on a neuron at a single timestep. In V-NeuroStack we assemble the 2-D movie frame data captured during spontaneous activity to visualize it as a 3-D time stack that the user can manipulate using given controls. Additionally, for every cross-sectional frame of the 3-D time stack, we generate a 2-D projection of the data at any time step which may then be explored for detailed analysis of the activity. A line graph depicting the intensities over the entire set of timesteps can be generated by clicking on a neuron in the 2-D projection. Button and slider controls can be used to change the portion of data used for visualization and a user interactive pointing device can be used to manipulate the 3-D time stack. Multiple data files are fed to our application: a timeseries file contains calcium intensities for each neuron at each timestep, an XYcoordinates file contains the location of each neuron on the image. Finally a file for each timestep identifies clusters of like-responding neurons; a Python script is used to extract the color associated with each cluster for the visualization. To generate the point cloud, V-NeuroStack uses the same x and y value for each neuron and populates a new z value to stack the neuronal activity in time. The result is a tube-like structure generated for each neuron for some or all available timesteps in the data. V-NeuroStack is written in JavaScript. In conclusion, we have implemented a tool to view patterns during spontaneous activity in mouse brain tissue that cannot be captured using a single 2-D view of the data. A visible pattern may either show like-colored neurons that belong to a particular cluster during a certain period of the activity or help in identifying strong correlation between the neurons for a given set of timesteps. An accompanying 2D image for any timestep can be viewed to gain greater detail of the neuronal activity. This flexibility in exploring patterns in firing of neurons has the potential to open up further research questions on understanding spontaneous as well as other forms of neuronal activity in any brain region.
Resources
URL
Citation
Naik, A.G., Kenyon, R.V., Berger-Wolf. T., Ibrahim, B., LLano, D.A., V-NeuroStack: 3-D time stacks for finding patterns in spontaneous activity of neurons in mouse brain slice, Program No. 432.09. 2019 Neuroscience Meeting Planner, Chicago, IL, Society for Neuroscience, October 21st, 2019. https://www.abstractsonline.com/pp8/#!/7883/presentation/49635