
Tom Peterka’s MS Thesis Defense
October 8th, 2003
Categories: Applications, MS / PhD Thesis, Visualization
About
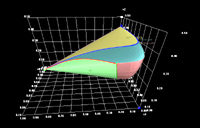
An application is developed for scientific visualization of n-dimensional (n-d) data for an attainable region (AR), a graphical tool for chemical reactor synthesis. Principles of interactive computer graphics, virtual reality, user interface design, and multivariate scientific visualization are employed in a real-time viewer capable of reading n-d AR input data and producing various views via dimension reduction and coordinate system settings.
Program features include interactive data probing, coordinate system controls, convex hull generation, real-time viewing transformations, and a well-developed user interface. A standard file format for the input of AR data has been developed as well. The application is a freely available open-source program that runs on most personal computers (PCs) under most
versions of the Windows operating systems, without requiring dedicated virtual reality (VR) hardware.
Two sample problems are documented, the first theoretical and the second an actual data set from current research in ARs. Collaboration with researchers has helped the application to evolve, and the program and results have been shared to help guide researchers in further studies. Preliminary feedback from collaborators has been positive.
Chemical engineering, like other engineering disciplines, often relies on graphical solutions for some types of problems. This works well for “textbook” problems, but unfortunately graphical methods are difficult to apply to many “real” problems because they are often much more complex. The increased complexity is due to increased number of variables, ie. larger dimensional space. For example, sample graphical problems are usually two-dimensional, while real problems easily may contain 10 or 20 variables. However, graphical solutions offer advantages over other numerical methods because of the visual perception of the human mind, so graphical solutions for multivariate problems are desirable. While it is difficult to visualize high dimensional data, a good visualization will reward the engineer with extremely comprehensible results.
One such graphical method in chemical engineering is called “attainable regions”, or AR. This is a geometric representation of the solution space of all possible combinations of selected unit operations for a system of chemical reactions, starting from a given feed point. The chemical engineer desires to find an optimal flowchart combination of reactors and mixers to optimize some objective function, such as production of a desired component, and the first step in this optimization process is to determine what compositions are feasible, or attainable. The attainable region is a convex closed solid in n-dimensional space, where n is the number of components in the chemical system.
The goal of this work is to meaningfully visualize the attainable region when the number of components is more than 2 or 3, which is what appears in much of the AR literature. The two sample problems that were tested are 4-dimensional and 5-dimensional, and the application is designed to accept even larger problem spaces. Concepts from several different disciplines are employed, from chemical engineering, scientific visualization, and computer science. The study of chemical engineering provides the basis for the attainable region method of modeling reactor synthesis problems. Concepts from the study of scientific visualization to graphically represent multi-dimensional data are utilized to maximize comprehension. Finally, several topics in computer science are explored to develop the computer application that serves as a test platform. 3-dimensional computer graphics, virtual reality, and user interface design, or human-computer interaction, all play vital roles in this work.
The main purpose of this research is to apply interdisciplinary principles of scientific visualization and computer science to meaningfully extend a practical chemical engineering problem to higher dimensions.