
Visualization of time-series biological data with spatial and non-spatial features embedded
July 22nd, 2015
Categories: Applications, MS / PhD Thesis, Visualization, Visual Analytics
About
EVL PhD candidate Chihua Ma presents approaches for visualizing biological data at EVL's summer tech talks.
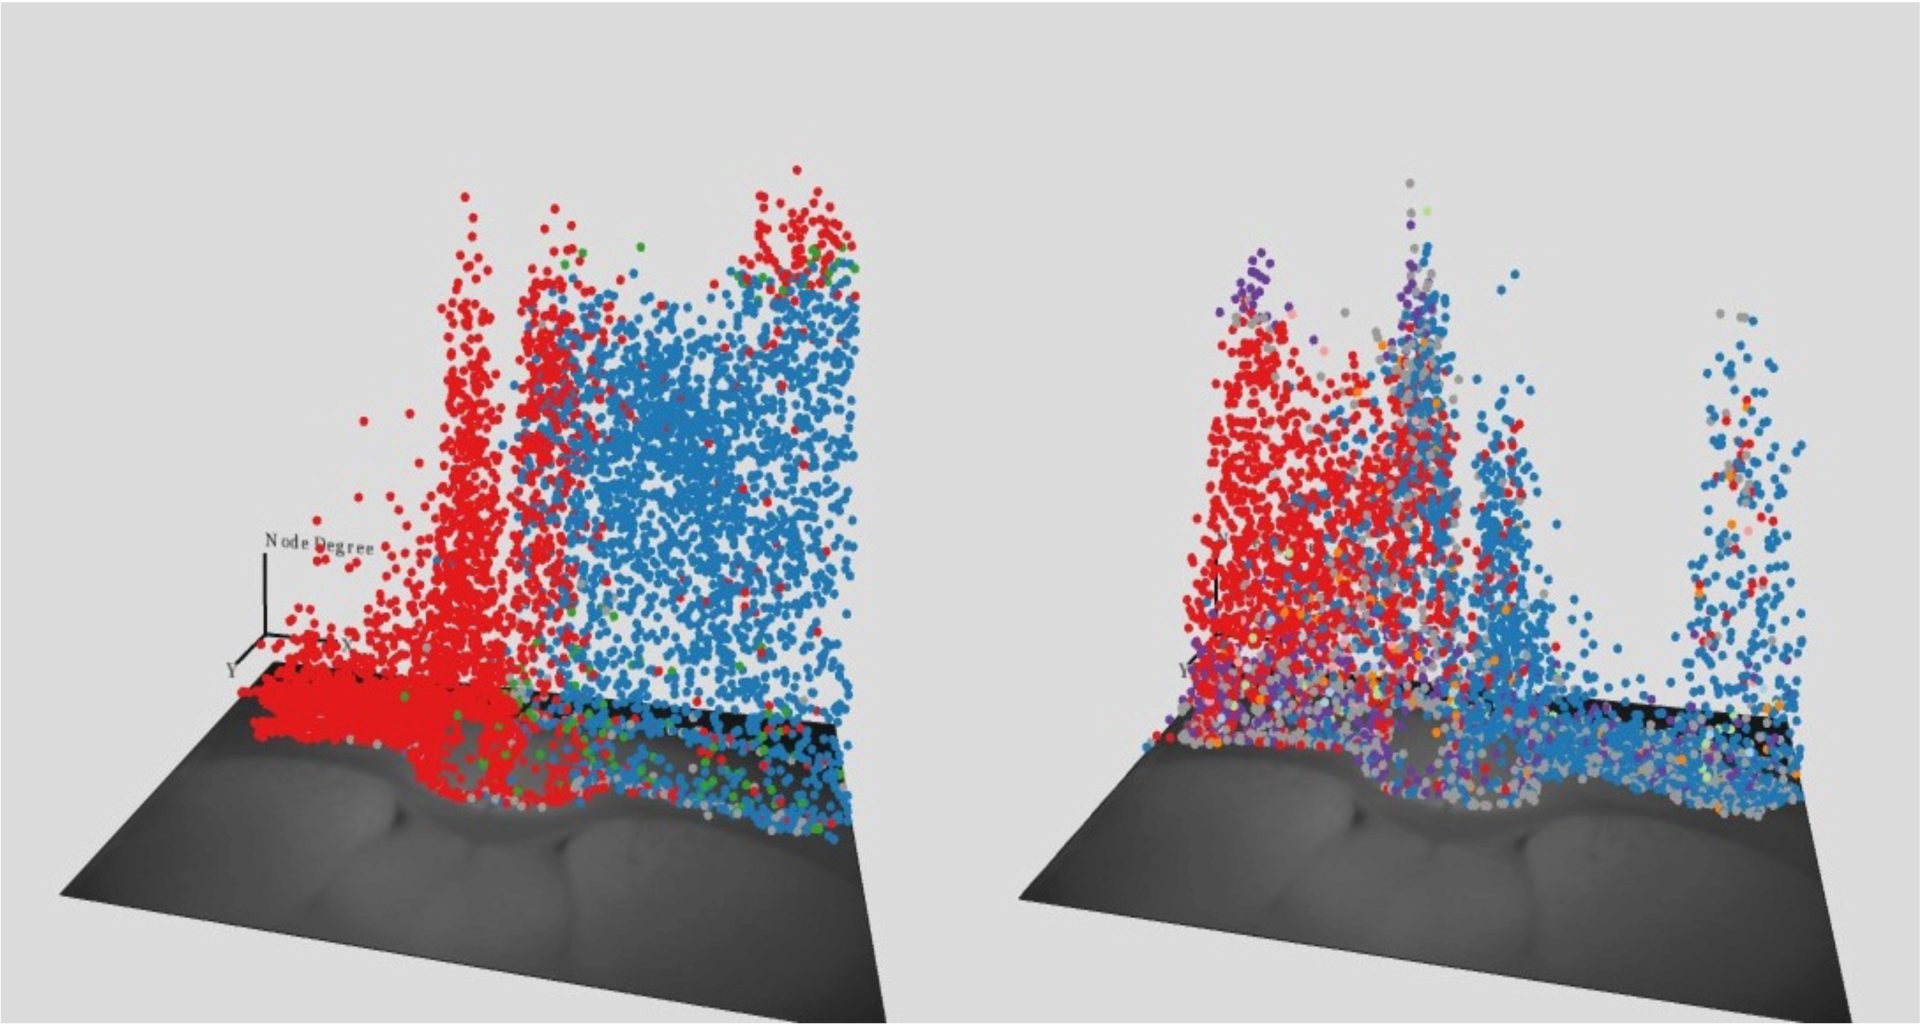
As biological systems dynamically change over time in nature, the measurement of timing effects should be taken into consideration to better understand the evolution of biological processes. Currently, two main visualization techniques for representing time are time-to-time mapping (animation) and time-to-space mapping (timeline plots and space-time cube). In addition, biological systems include both spatial and non-spatial information. Using multiple and coordinated views is considered to be a good approach to integrate spatial and non-spatial features.
This presentation introduces relevant approaches for visualizing spatial/non-spatial time-based data followed by two case studies: visualization of dynamic mouse brain networks and visualization of probability distributions at the steady states in the FFL network motif.