
EVL Showcases Research in NLR Exhibit at SC ’05
November 12th, 2005 - November 18th, 2005
Categories: Applications, Data Mining, Devices, Networking, Software, Supercomputing, Visualization, VR
About
EVL participates at SC|05 as an OptIPuter partner in the National LambdaRail booth (#6003), showcasing hardware and software developed with major support from the National Science Foundation.
H A R D W A R E
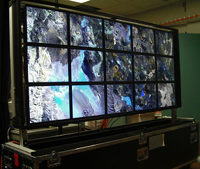
GeoWall2
The GeoWall2 is a portable, high-resolution (8000 x 3600 pixels) 15- tile LCD system powered by a 10-node OptIPuter 64bit cluster. Applications of GeoWall2 include the visualization of large remote sensing data, scientific volume rendering imagery, mapping, seismic interpretation, museum exhibits and other applications that require a large collaborative screen area.
The GeoWall2 was designed and built at the University of Illinois at Chicago’s Electronic Visualization Laboratory with funding from the National Science Foundation. The GeoWall2 on display at SC|05 is on loan from OptIPuter partner USGS / EROS Data Center in Sioux Falls, SD.
Varrier Auto-Stereoscopic Virtual Reality Display
Daniel J. Sandin, Thomas A. DeFanti, Jinghua Ge, Javier Girado, Robert Kooima and Tom Peterka
Electronic Visualization Laboratory (EVL), University of Illinois at Chicago (UIC)
Contact: dan @ evl.uic.edu
Varrier is a high-resolution, head-tracked autostereoscopic display system that produces a virtual reality immersive experience without requiring the user to wear any encumbrances. Varrier refers to both the display system, and the computational method used to produce the autostereoscopic imagery through a combination of a physical parallax barrier and a virtual barrier. Camera-based head tracking with artificial neural networks is used to track user head position at interactive frame rates.
Varrier was designed and built at University of Illinois at Chicago’s Electronic Visualization Laboratory with funding from the National Science Foundation. It is a 35-panel tiled display that produces a wide field of view, head-tracked virtual reality experience. The Varrier system at SC|05 is a single 30 panel display.
Networked and local application demonstrations include: a U.S. Geological Survey topological map of Crater Lake; a live 3D teleconferencing session from EVL in Chicago, Illinois; Mars Rover data; photon-beam tomography by Marcus Thiébaux, Information Sciences Institute, University of Southern California; and animated microscopy imaging by Steve Lamont, National Center for Microscopy and Imaging Research, University of California, San Diego.
S O F T W A R E
Scalable Adaptive Graphics Environment (SAGE)
Luc Renambot, Jason Leigh, Byungil Jeong, Andrew Johnson, Nicholas Schwarz and Venkatram Vishwanath
Electronic Visualization Laboratory (EVL), University of Illinois at Chicago (UIC)
The Scalable Adaptive Graphics Environment (SAGE) is a graphics streaming architecture for supporting collaborative scientific visualization environments with potentially hundreds of megapixels of contiguous display resolution is a distributed computing architecture that supports easy migration of visualization tools between computing environments. SAGE addresses both heterogeneity and scalability by decoupling graphics rendering from graphics display, and uses high bandwidth networking to bridge them.
The SAGE architecture consists of numerous rendering resources connected over a high-speed network to a scalable frame buffer. The hardware is built from commodity hardware components that can be arranged to scaled to manage any resolution of display screen. Using SAGE, multiple datasets applications can be visualized simultaneously on a large tiled display. This is achieved by executing multiple instances of an application, then comparing lets the user compare and analyze multiple the datasets, or multiple views of the same dataset. SAGE application windows can be moved, resized and overlapped like any standard desktop window manager.
SAGE streaming capabilities currently enable users to visualize remotely stored datasets from several distributed clusters over wide area networks and display them on the local tiled display. SAGE is now being extended to support distance collaboration with multiple endpoints, by streaming pixels to all the participants using either traditional router-based multicasting or photonic multicasting. This will allow, once the multicasting capability is added to SAGE, distributed collaborators using different displays to effectively share the same visualization data without wasting network bandwidth.
EVL is also developing LambdaRAM middleware, new streaming protocols and real-time compression modules to improve SAGE’s pixel streaming capabilities. Ultimately, SAGE will be extended to stream other graphics data types to support a wider range of applications, and SAGE applications will rely on LambdaRAM to access large datasets.
LambdaRAM allows applications to seamlessly access very large remote datasets over high-bandwidth networks, and overcome the large latencies that are characteristic of long haul networks. LambdaRAM harnesses the memory of multiple distributed wide-area clusters and presents a single global memory abstraction to the application. It also employs aggressive pre-fetching heuristics based on access patterns to cache data for applications. This helps tremendously to overcome latency - a critical requirement in large remote data visualization and data mining.
At SC|05, SAGE is supporting the following applications on the GeoWall2: HDTV live streaming from EVL in Chicago; JuxtaView (UCSD/ NCMIR microscopy data and USGS Urban Area datasets); Magic Carpet (New Orleans, San Diego and Blue Marble datasets); and UIUC / NCSA and EVL HD animations.