
Echo: A Large Display Interactive Visualization of ICU Data for Effective Care Handoffs
October 2nd, 2017
Categories: Applications, User Groups, Visual Analytics, Visual Informatics, Remote Collaboration
Authors
Thomas, M., Kanampallil, T., Abraham, J., Marai, G.E.About
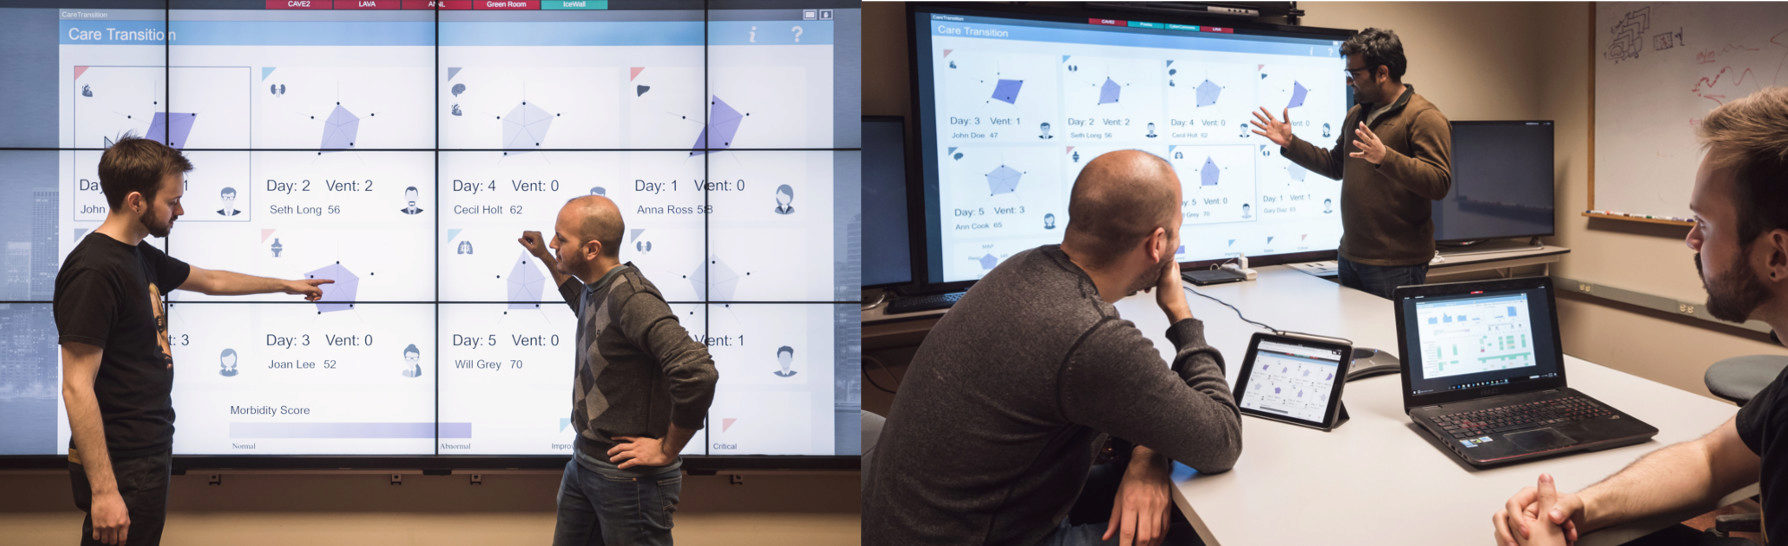
One of the significant challenges of care transitions in Intensive Care Units (ICUs) is the lack of effective support tools for outgoing
clinicians to find, filter, organize, and annotate information that can be effectively handed off to the incoming team. We present a large display interactive multivariate visual approach, aimed towards supporting clinicians during the transition of care. We first provide a characterization of the problem domain in terms of data and tasks, based on an observation session at the University of Illinois Hospital, and on interviews with several biomedical researchers and ICU clinicians. Informed by this experience, we design a scalable, interactive visual approach that supports both overview and detail views of ICU patient data, as well as anomaly detection, comparison, and annotation of the data. We demonstrate a large-display implementation of the visualization on an existing anonymized ICU dataset. Feedback from domain experts indicates this approach successfully meets the requirements of effective care transitions.
Index Terms: ICU care transition, large display visualization, shared cognition, collaborative decision making
Resources
Citation
Thomas, M., Kanampallil, T., Abraham, J., Marai, G.E., Echo: A Large Display Interactive Visualization of ICU Data for Effective Care Handoffs, IEEE 8th Workshop on Visual Analytics in Health Care VAHC’17, Phoenix, AZ, pp. 1-8, October 2nd, 2017.