
PRODIGEN: visualizing the probability landscape of stochastic gene regulatory networks in state and time space
October 24th, 2017
Categories: Applications, User Groups, Visual Analytics, Visual Informatics
Authors
Ma, C., Luciani, T., Terebus, A., Liang, J., Marai, G.E.About
Background: Visualizing the complex probability landscape of stochastic gene regulatory networks can further
biologists’ understanding of phenotypic behavior associated with specific genes.
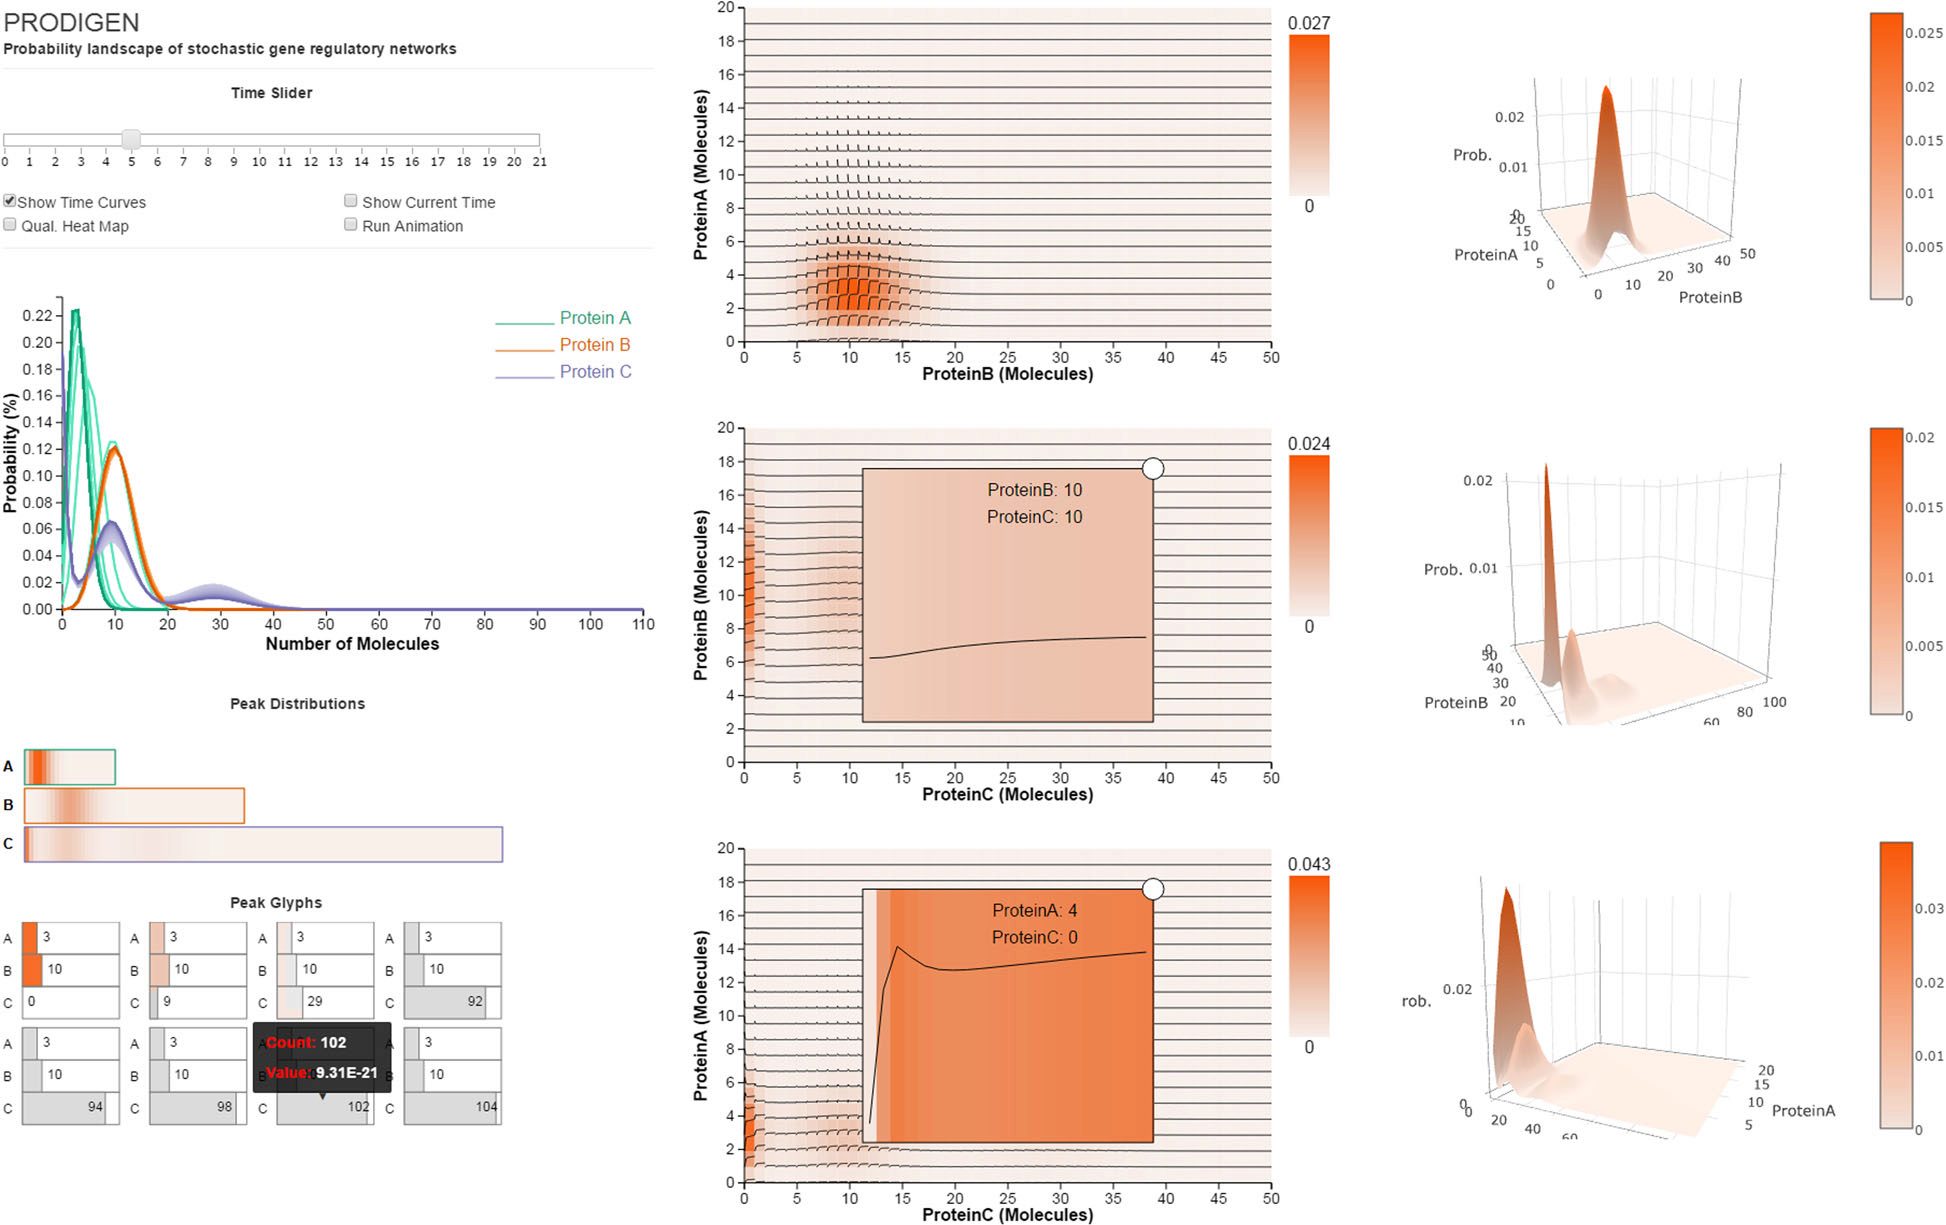
Results: We present PRODIGEN (PRObability DIstribution of GEne Networks), a web-based visual analysis tool for the systematic exploration of probability distributions over simulation time and state space in such networks. PRODIGEN was designed in collaboration with bioinformaticians who research stochastic gene networks. The analysis tool combines in a novel way existing, expanded, and new visual encodings to capture the time-varying characteristics of probability distributions: spaghetti plots over one dimensional projection, heatmaps of distributions over 2D projections, enhanced with overlaid time curves to display temporal changes, and novel individual glyphs of state information corresponding to particular peaks.
Conclusions: We demonstrate the effectiveness of the tool through two case studies on the computed probabilisti landscape of a gene regulatory network and of a toggle-switch network. Domain expert feedback indicates that our visual approach can help biologists: 1) visualize probabilities of stable states, 2) explore the temporal probability distributions, and 3) discover small peaks in the probability landscape that have potential relation to specific diseases.
Keywords: Systems biology, Feature detection and tracking, Network analysis, Modelling/Simulation
Resources
URL
Citation
Ma, C., Luciani, T., Terebus, A., Liang, J., Marai, G.E., PRODIGEN: visualizing the probability landscape of stochastic gene regulatory networks in state and time space, 6th Symposium on Biological Data Visualization, Baltimore, MD, BMC Bioinformatics 18(2):24, 2017, pp. 1-13, October 24th, 2017. https://doi.org/10.1186/s12859-016-1447-1