
MC2 - Mining Factory Pollution Data through a Spatial-Nonspatial Flow Approach
October 1st, 2017
Categories: Applications, Visual Analytics, Visual Informatics
Authors
Castor, J., Borowicz, J., Burks, A., Thomas, M., Luciani, T., Marai, G.E.About
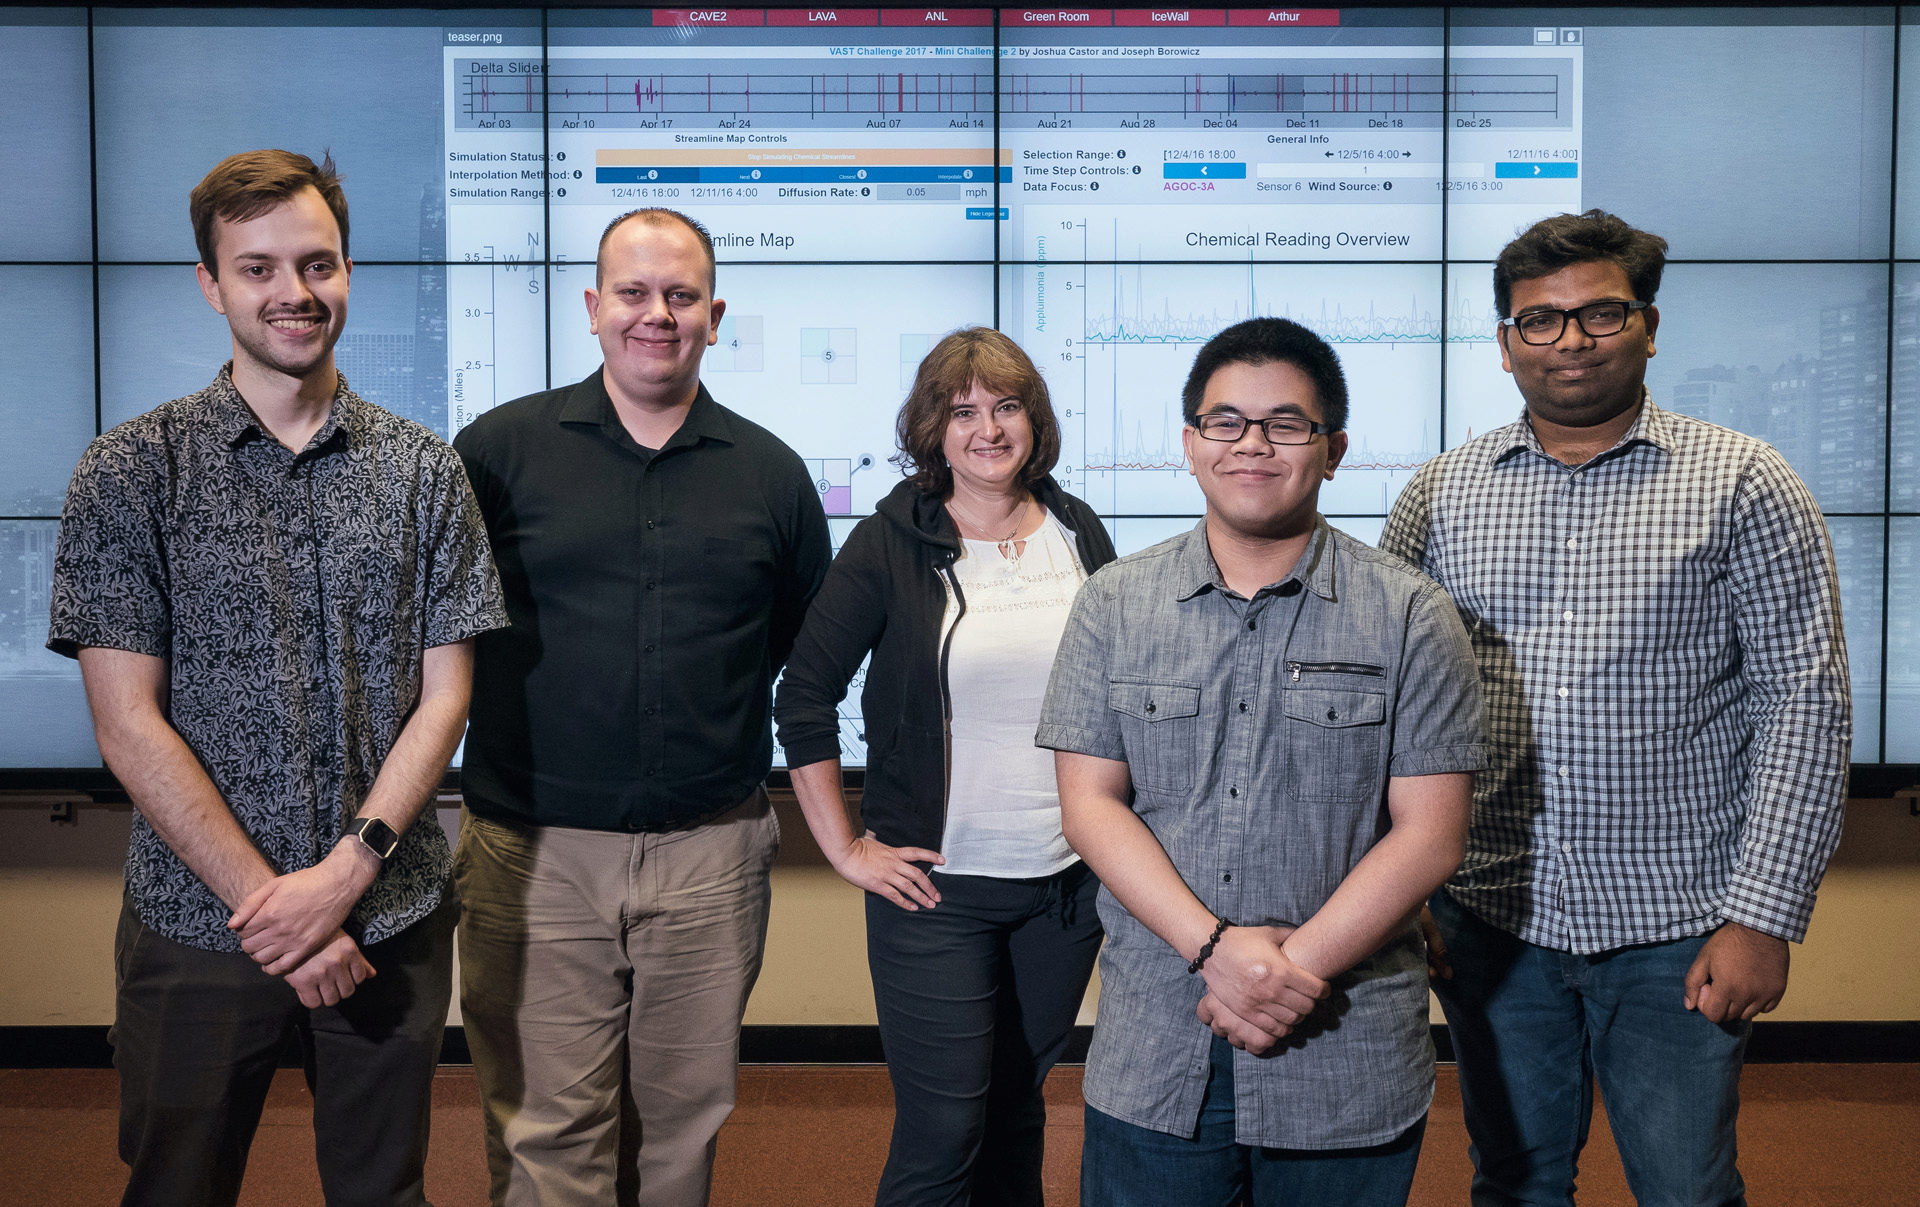
Mini Challenge 2 of the VAST Challenge 2017 focused on a small industrial area south of the fictional Mistford preserve, specifically around four manufacturing factories. Our main goal was to develop a visual analytics tool to explore the spatio-temporal chemical readings and wind data. Specifically, we wanted to determine which factories were responsible for emitting which chemicals and to determine the performance of the nine sensors in the area. In order to help achieve this goal, we developed a web-based application that utilizes interactive visualizations and path line analysis for revealing sensor errors and chemical reading spikes, along with pinpointing the possible sources of chemical reading spikes.
Resources
Citation
Castor, J., Borowicz, J., Burks, A., Thomas, M., Luciani, T., Marai, G.E., MC2 - Mining Factory Pollution Data through a Spatial-Nonspatial Flow Approach, IEEE Visual Analytics Science and Technology (VAST) Challenge 2017 Proceedings, Phoenix, AZ, pp. 1-2, October 1st, 2017.