UIC/EVL Receives Two Honorable Mentions in IEEE VIS 2017 VAST Challenge
September 11th, 2017
Categories: Applications, Visual Analytics, Visual Informatics

About
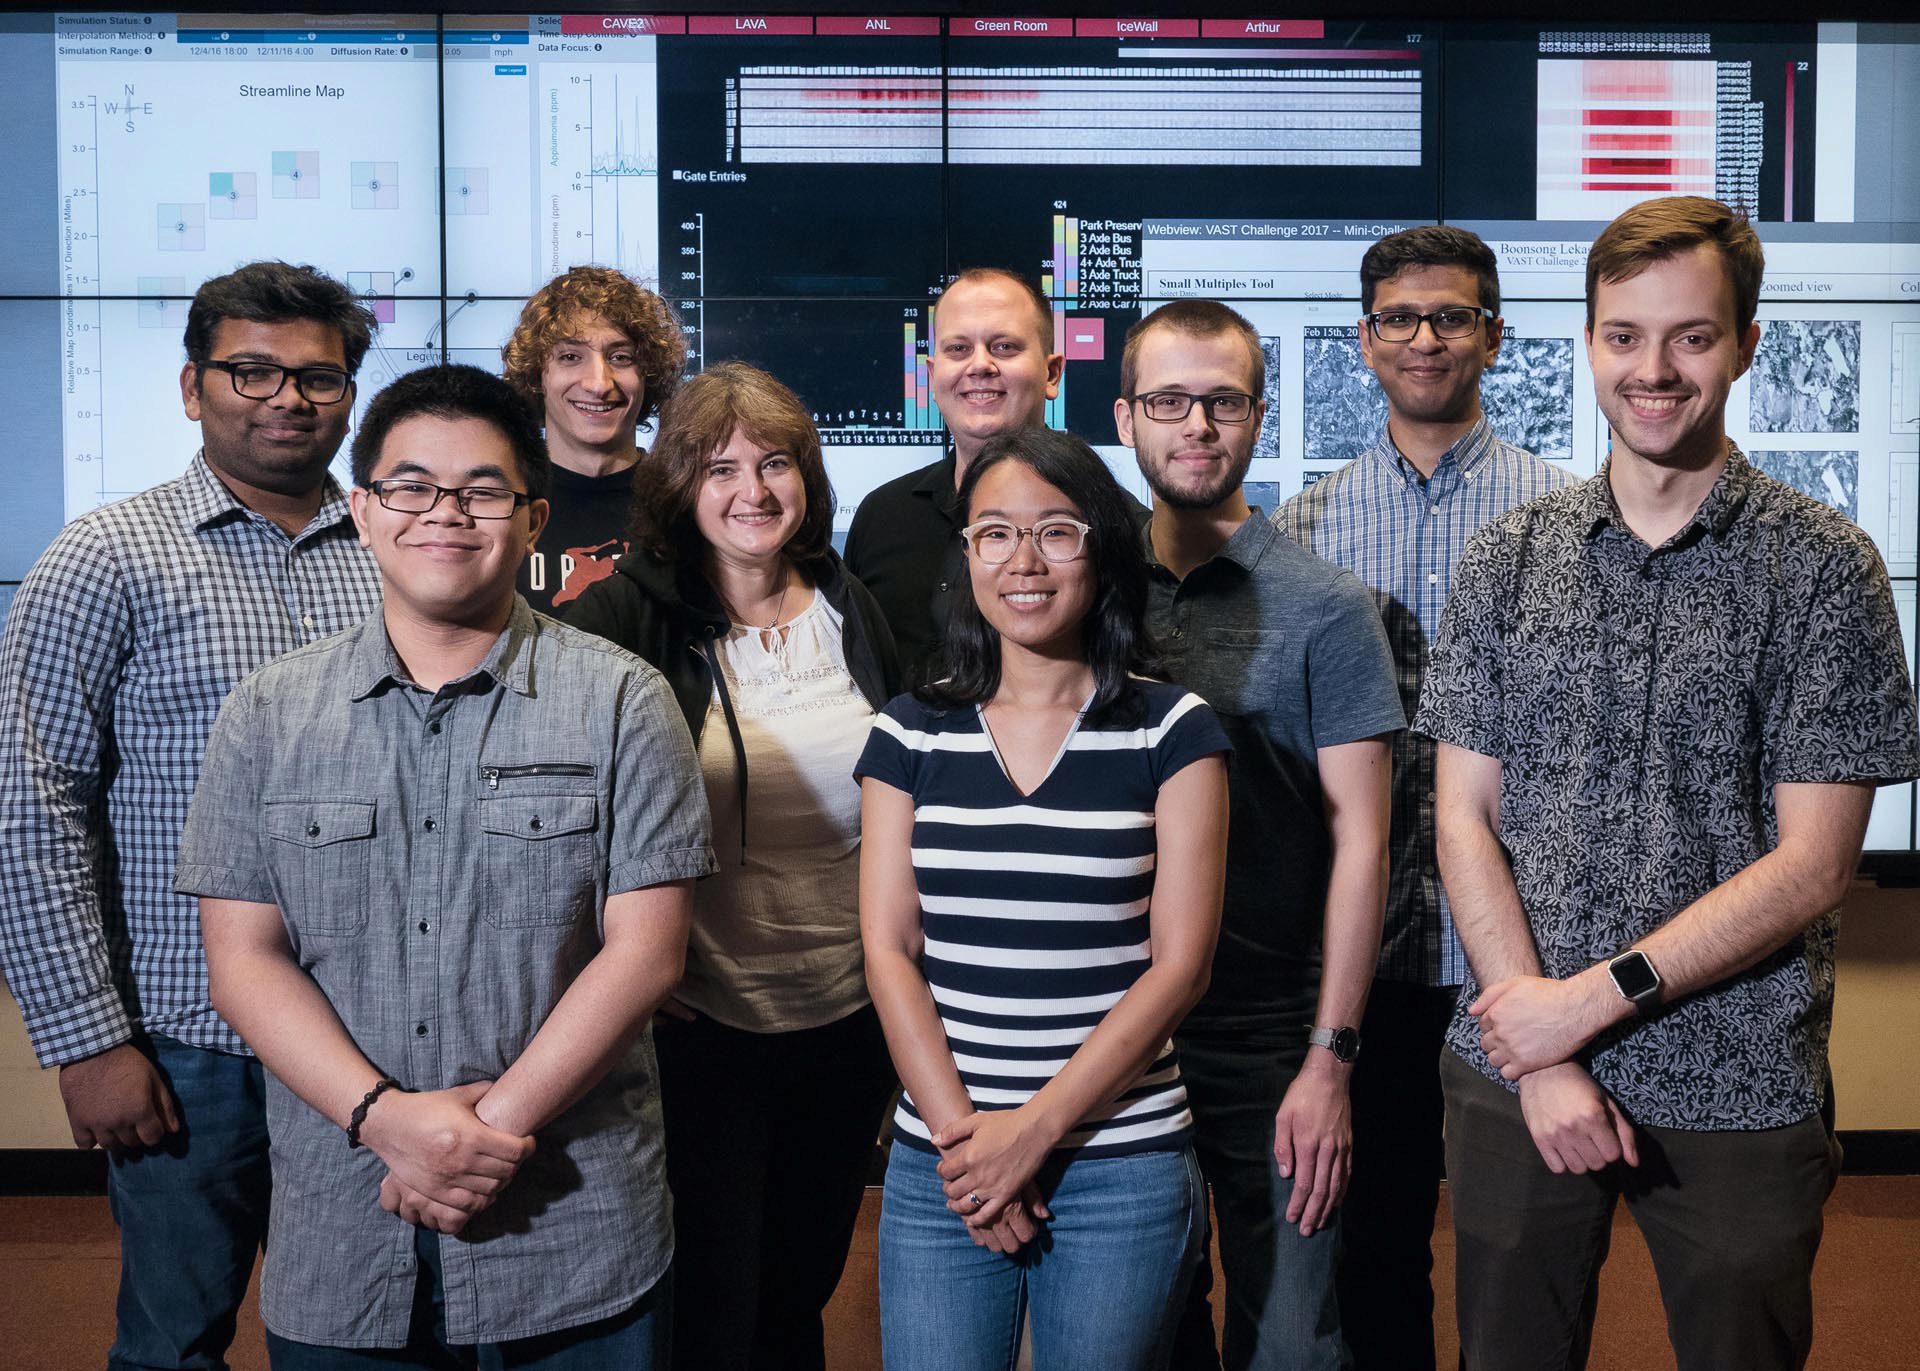
SEPTEMBER 11, 2017 - UIC Computer Science (CS) Associate Professor G. Elisabeta (Liz) Marai loves to inspire and educate next-generation computer scientists. For several years now, she has selected the best and brightest undergraduates from her Fall and Spring courses and, pending financial support, offers them both summer research experiences and extracurricular activities to accelerate their knowledge of visualization and visual analytics technologies and techniques.
Earlier this year, Marai reached out to CS faculty, and particularly CS faculty affiliated with the Electronic Visualization Laboratory (EVL), to ask if they would join her in hiring her undergrads on grants, with funding provided by the NSF Research Experiences for Undergraduates (REU) program or by private donors. While the students would be paid to work on a variety of projects, Marai would also provide them with extracurricular work - participating in the 12th Visual Analytics Science and Technology (VAST) Challenge, hosted annually by the international IEEE Visualization (VIS) conference.
Months prior to the IEEE VIS conference, the VAST Challenge publishes several problems (a Grand Challenge and three Mini-Challenges) around one theme. This year, it focused on a fictitious mid-size city with a small industrial area located near a wildlife preserve, where it was discovered that the population of a specific local bird was decreasing. Each of the VAST problems provided different datasets, with different questions about “who-what-where-why-when–how”. For each problem, the goal was to design and develop specific visual analytics tools to help the local ornithologist determine what was happening to the birds.
How do undergrad sophomores and juniors deal with such a competition? They work together in teams, and they learn a lot about visualization, visual analytics, programming, and web design and development. And, they are mentored by Marai’s PhD/MS students, as well as other EVL faculty, staff and students.
This year’s VAST Challenge received 56 submissions from individuals and teams in industry, government, and academia. EVL student teams submitted three entries, one for each Mini-Challenge; two EVL submissions received Honorable Mention awards and one was well reviewed but did not receive an award. Given these submissions were led by undergraduates, most of whom had never done visualization before (most were students from Marai’s CS342 software design course), that’s a huge accomplishment!
All the student teams wrote two-page papers about their entries that will be published in the IEEE VIS 2017 electronic conference proceedings. Marai will fund two students to attend this year’s IEEE VIS conference, to be held October 1-6, 2017 in Phoenix, AZ, to present their solutions, and to receive their Honorable Mention certificates on behalf of their teammates.
# # # # # #
Here is a summary of the three projects.
Mini-Challenge #2: Honorable Mention for Clarity in Visual Communication
Project: “Mining Factory Pollution Data through a Spatial-Nonspatial Flow Approach”
UIC Participants: Undergraduates Joshua Castor, Joseph Borowicz and Andrew Burks; graduate students Manu Thomas and Timothy Luciani; and, faculty mentor Liz Marai.
The dataset provided several months of meteorological data (wind speed and direction) and chemical data emitted by four industrial factories and captured by nine sensing stations. To explore the spatio-temporal chemical readings and wind data, specifically which factories emitted what chemicals and how the nine sensors in the area were performing, the team developed a web-based analytics tool with interactive visualizations and path line analysis to reveal sensor errors and chemical reading spikes, as well as pinpoint possible sources of chemical reading spikes. The goal was to help the local ornithologist determine whether or not the factories were compliant with environmental regulations.
Mini-Challenge #3: Honorable Mention for Good Interactive Image Explorer for Temporal Analysis
Project: “Web-Based Interactive Image Explorer for Temporal Analysis of Satellite Images”
UIC Participants: Undergraduates Vijayraj Mahida, Bartosz Kupiec and Andrew Burks; graduate student Timothy Luciani; and, faculty mentor Liz Marai.
The dataset provided satellite imaging data from commercial multi-spectral imagers that routinely cover the nature preserve every few weeks. The team developed a web-based image analysis tool that combined small, multiple views of satellite images, linked semantic zooming and image intensity histograms, along with filter controls. The goal was to help the local ornithologist interactively analyze spatio-temporal changes to understand the health of the wildlife preserve and alert him to possible conditions that might be impacting the birds.
Mini-Challenge #1: No IEEE award, but kudos to the students for participating!
Project: “A Bespoke Analysis Tool for Spatio-temporal Park Traffic Data”
UIC Participants: Undergraduates Dimitar Kirilov, Isabel Lindmae and Andrew Burks; graduate student Chihua Ma; and, faculty mentor Liz Marai.
The dataset provided resident and tourist vehicle traffic in the preserve, for day trips, overnight camping, etc., as a data stream with vehicle types and entry/exit timestamps. The team developed a web-based traffic-data analysis tool that consisted of two linked heat maps showing daily activity for vehicles, as well as a histogram showing the total time spent by vehicles in the park. Combined, these views enabled the analysis of both spatial and temporal patterns in the wildlife preserve, helping the local ornithologist identify traffic patterns, correlations, or anomalies to aid his investigations.
# # # # # #
The IEEE VIS 2017 VAST Challenge Awards are listed on the IEEE VIS 2017 website:
http://ieeevis.org/year/2017/info/awards/vast-challenge-awards
The IEEE VIS VAST Challenge 2017 website:
http://www.vacommunity.org/VAST+Challenge+2017
Note: At IEEE VIS 2016, Marai and EVL undergraduate and graduate students won Honorable Mention in the third International Data Visualization Contest organized by the IEEE Visualization and Graphics Technical Committee’s (VGTC) Visualization Pioneers Group (VPG). See: https://www.evl.uic.edu/entry.php?id=2247