
Precision Risk Analysis of Cancer Therapy with Interactive Nomograms and Survival Plots
August 1st, 2018
Categories: Applications, Visual Analytics, Visual Informatics
Authors
Marai, G.E., Ma, C., Burks, A., Pellolio, F., Canahuate, G., Vock, D., Mohamed, A.S.R., Fuller, C.D.About
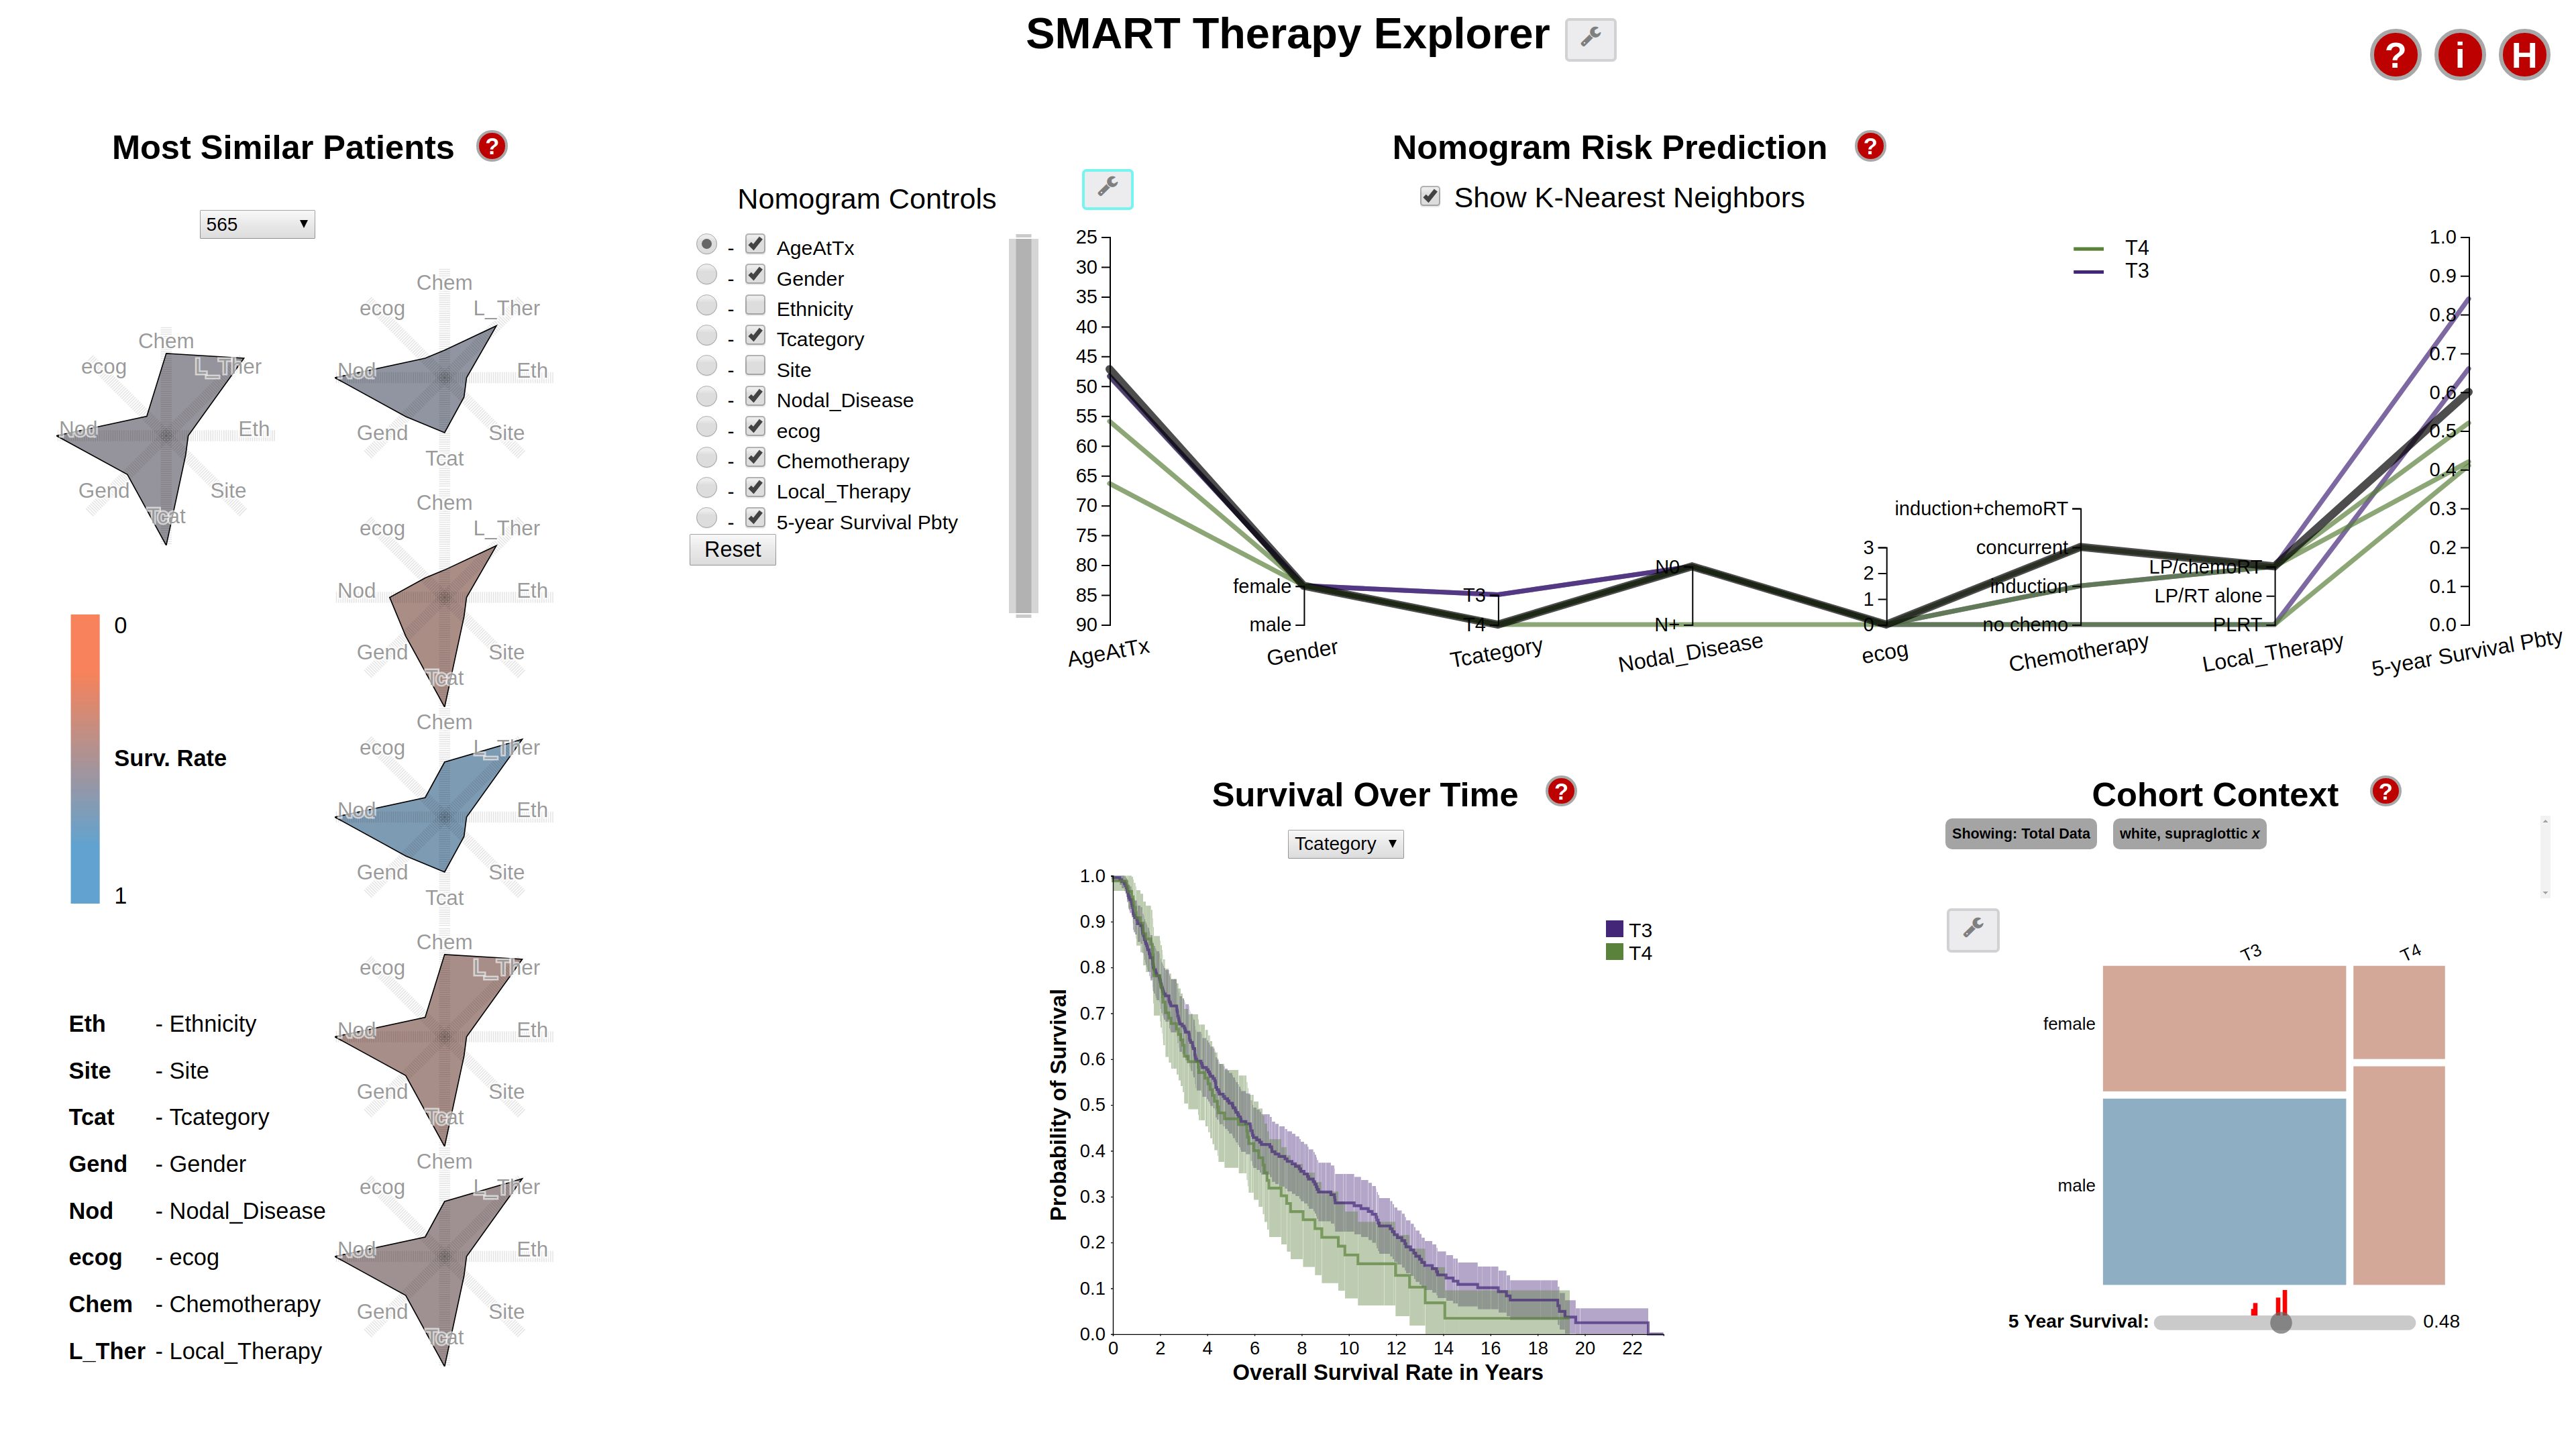
We present the design and evaluation of an integrated problem solving environment for cancer therapy analysis. The environment intertwines a statistical martingale model and a K Nearest Neighbor approach with visual encodings, including novel interactive nomograms, in order to compute and explain a patient’s probability of survival as a function of similar patient results. A coordinated views paradigm enables exploration of the multivariate, heterogeneous and few-valued data from a large head and neck cancer repository. A visual scaffolding approach further enables users to build from familiar representations to unfamiliar ones. Evaluation with domain experts show how this visualization approach and set of streamlined workflows enable the systematic and precise analysis of a patient prognosis in the context of cohorts of similar patients. We describe the design lessons learned from this successful, multi-site remote collaboration.
Index Terms - Visual analytics, precision medicine, design studies, nomograms, parallel coordinate plots, activity-centered design.
Support:
National Institutes of Health:
NCI-R01-CA214825, “SMART-ACT: Spatial Methodologic Approaches for Risk Assessment and Therapeutic Adaptation in Cancer Treatment”
NCI-R01CA225190,“QuBBD: Precision E –Radiomics for Dynamic Big Head & Neck Cancer Data”
National Science Foundation:
NSF-CNS-1625941, “MRI - Development of Continuum: A Virtualized Attentive Environment for Amplified Collaboration”
NSF-DMS-1557559, “QuBBD Collaborative Research SMART Spatial Nonspatial Multidimensional Adaptive Radiotherapy Treatment”
Resources
URL
Citation
Marai, G.E., Ma, C., Burks, A., Pellolio, F., Canahuate, G., Vock, D., Mohamed, A.S.R., Fuller, C.D., Precision Risk Analysis of Cancer Therapy with Interactive Nomograms and Survival Plots, IEEE Transactions on Visualization and Computer Graphics, vol 14, pp. 1-13, August 1st, 2018. https://ieeexplore.ieee.org/document/8320386/