
Fourteenth Annual IRIS Workshop
June 12th, 2002 - June 15th, 2002
Categories: Applications, Data Mining, Human Factors, Networking, Software, Tele-Immersion, Visualization
About
EVLer Atul Nayak and Paul Morin (University of Minnesota) are taking the AGAVE / GeoWall to the 14th Annual IRIS Workshop to show how the AGAVE can be used to visualize seismic activity. The Incorporated Research Institutions for Seismology (IRIS) is a university research consortium dedicated to exploring the Earth’s interior through the collection and distribution of seismographic data. Support for IRIS comes from the National Science Foundation, other federal agencies, universities, and private foundations.
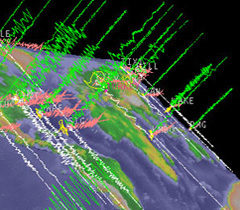
Traditionally seismologists look at 2D X-Y plots of a timeseries of the displacement of a seismometer in the North-South, East-West and Up-Down directions. The 3D nature of the data is ideal for visualization on the AGAVE. Atul will use Immersaview to display data recorded by a network of seisometers spread across the world when an earthquake hit Turkey (August 17, 1999, Magnitude 7.6 Richter scale).
At each of the 20-30 stations, you can see three wiggles and a particle zipping by rapidly. Each wiggle represents one of the three components of the seismicity - so the red wiggle is the displacement of the seismometer in the Up-Down direction, the green wiggle is the North-South displacement and the white wiggle is the motion in the East-West direction. The latest data is displayed at the location of the station and the previous samples gradually travel out along the three directions. A yellow particle moves around the station leaving behind a trace of the velocity of a particle in the Earth. This is significant because it is the first time seismologists can actually playback in stereo how the Earth moved at the station as the seismic waves hit it.
Another event that will be demonstrated is the earthquake that struck Anza, Southern Calfornia (31 October 2001, Mag:5.1). The visualization includes a simultaneous display of the motion of a particle at more than 30 seismometers on the IRIS / USGS network. So seismologists can simply choose the event and stations that want to look at, pull data off the IRIS server and feed it to the program.
Immersaview is software developed by the CAVERN group at EVL. It allows you to interact with 3D content on the AGAVE / GeoWall.
Related links:
www.evl.uic.edu/cavern/agave/immersaview
www.evl.uic.edu/cavern/agave
www.iris.edu
geowall.org