
Wiggleview
September 1st, 2002 - August 30th, 2003
Categories: Applications, MS / PhD Thesis, Software, Visualization
About
Wiggleview is a tool developed by the Electronic Visualization Laboratory (EVL) at the University of Illinois at Chicago (UIC) for visualizing seismic data collected from a worldwide network of seismometers. Data for seismic events is obtained from repositories maintained by IRIS (Incorporated Research Institutions for Seismology) at the Data Management Center (DMC) in Seattle, Washington.
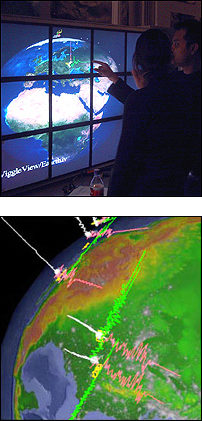
The visualization consists of overlaying familiar 2D seismic traces recorded for the N-S, E-W and vertical components of the earth’s displacement over the topographic map of the affected area. In addition, a 3D particle trace consisting of the integration of these 3 components provides a depiction of how an object placed at a particular seismic recording station would shake at the instant of the event.
Suppose a seismologist wants to examine data gathered when an earthquake measuring 7.2 on the Richter scale hit Turkey on October 31,1998. Wiggleview displays data at 20 stations for this event.
The tool’s strength lies in being able to depict as many as 60 channels of waveforms and 20 traces of particle motion on a single display. This allows one to watch the seismic wave field expand about a source and see how it differs from place to place. It can also assist in understanding surface wave multipathing and anisotropy - this is important for revealing structure and for seismic hazard estimation.
Wiggleview was designed for two display platforms: the standard PC-based desktop or laptop with a modern-day game graphics card; and a stereoscopic projection system called the Geowall. The stereoscopic nature of the images enhances depth perception and thus allows better understanding of attenuation due to distance and earth structure, source directivity and seismic hazard estimation.