
GeoWall2 for Informal Science Education in Museums
May 1st, 2005 - January 13th, 2009
Categories: Applications, Devices, Education, Human Factors, Visualization
About
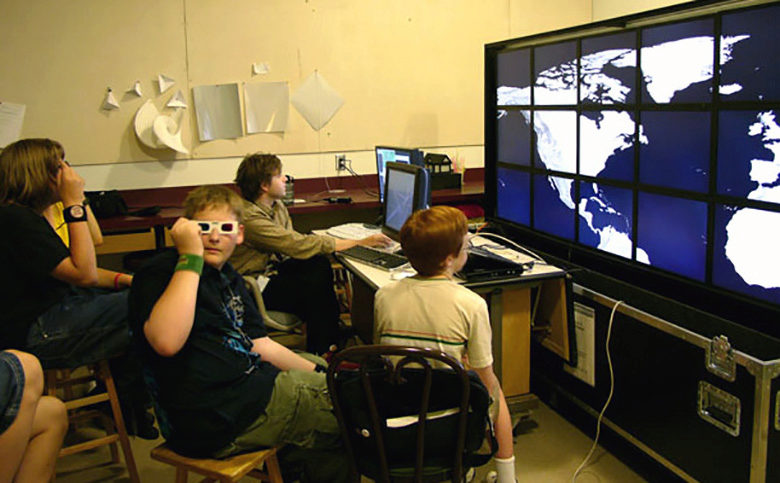
The GeoWall2 is a tiled advanced visualization system (5x3 array of LCD panels) designed to cost-effectively serve Geoscience applications that require greater display resolution and visualization capacity in museum, gallery and other public settings. The current goal for the GeoWall2 project is to develop informal science education applications using this cutting edge technology into a fun and comprehendible experience for the audience / participants.
EVL is collaborating with the Environmental Sciences and Earth-system Science team at the Science Museum of Minnesota, in conjunction with the University of Minnesota and National Center for Earth Surface Dynamics to explore whether and how visualization technologies that largely have been developed with research applications in mind, can be adapted to serve the educational needs of large public audiences.
In recent decades, remote sensing technologies - from seismometers to satellites - have become capable of acquiring planet-wide data. And in the past few years, communication and computer systems have become sophisticated enough to create planet-wide portraits of Earth. All scientific visualizations are, to lesser or greater degrees, abstractions. The risk with GeoWall2 or any other scientific visualization is that audiences might not be able to comprehend the visualizations. And not only must people understand what they are viewing, but they must somehow be able to interact with and manipulate what they are seeing. If an exhibit component does not offer the potential for interactivity, then its ability to encourage people to engage more deeply in its scientific content is severely limited.
Not only do people eventually need to be able to view and interact with the GeoWall2, they need to do so without the assistance of a museum staff person. It is not possible or practical to intensively staff exhibitions, so truly effective exhibit components quickly communicate what they are about to museum visitors and allow museum visitors somehow to interact with them.
The current focus of GeoWall2 research is to conduct prototyping in order to explore what visual clues visitors need to see on the tiled wall so that they quickly understand what they are viewing and what ways might be most effective in allowing them to interact with GeoWall2 datasets.
The results of this investigation will be directly applicable to the development of the upcoming Science Museum of Minnesota’s WATER PLANET exhibition. Current experiments will incorporate datasets relevant to this planning exhibition.
- Groundwater - Can GeoWall2 help museum visitors to comprehend how water actually flows through the earth? Might a dynamic groundwater model be run on GeoWall2 that computes interactions between aquifers, wells, land use, and surface waters? Might a visitor be able to alter their point of view (zoom in and see the porosity and conductivity of groundwater at the microscopic level or zoom out to see the movement of groundwater over long distances) or investigate cause and effect by changing one or more variables, such as rates of well pumping or surface water infiltration?
- Geophysical Processes - Might GeoWall2 help museum visitors to understand the physical processes that mediate mantle and crustal processes? Could GeoWall2 provide a 3D perspective of the Earth whereby museum visitors could plot the locations and depths of earthquakes and thus see the surfaces along which ocean floors are subducting under continental plates? Can plate motion animated over time and the evolution of the ocean basins be displayed?
- Crysophere - Might GeoWall2 allow museum visitor to explore in great detail landscapes that few of them will ever see, such as the ice cap of Greenland or the continent of Antarctica? Could they melt away their ice covers both to reveal the actual contours of the land masses below and to see the impact the release of these frozen stores of water would have on coastal regions around the globe?
- River Processes - How can the evolution of river systems and channel networks be best illustrated? Can LANDSAT and computer models help convey these processes?