COVID-19 EnsembleVis: Visual Analysis of County-level Ensemble Forecast Models
May 16th, 2021 - Ongoing
Categories: Applications, Software, User Groups, Visualization, Visual Analytics, Visual Informatics, Data Science

About
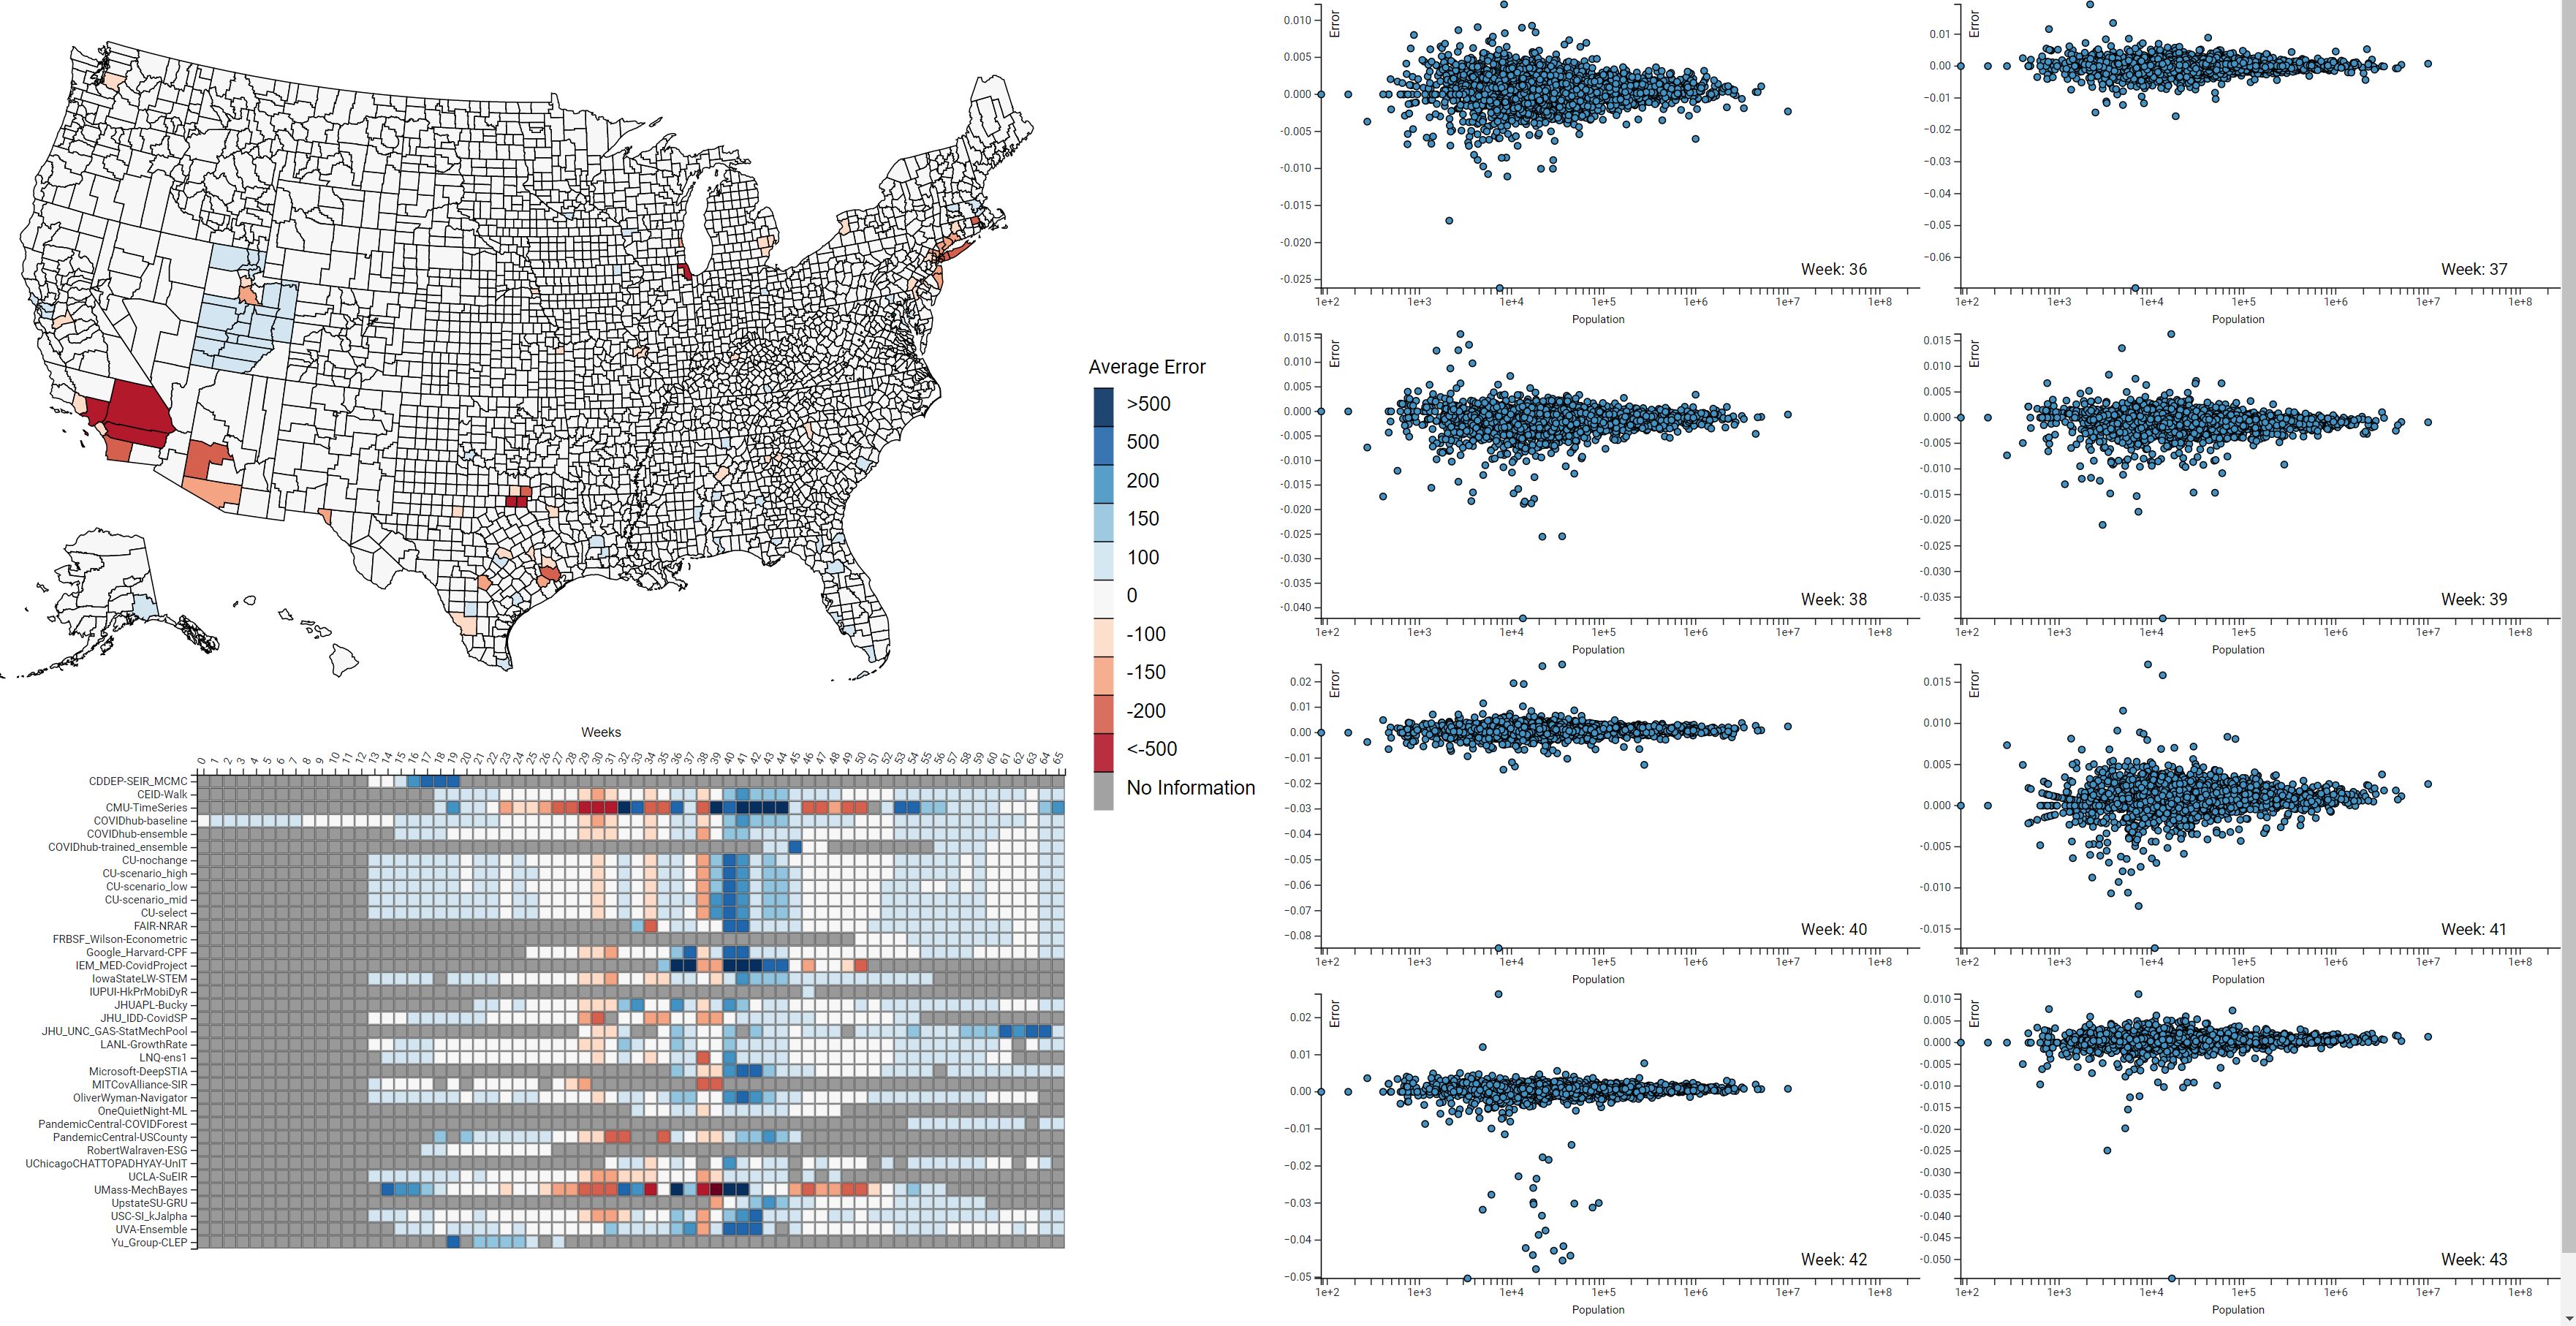
The COVID-19 pandemic has upended the world over the past year, in a health crisis not seen since the 1918 flu pandemic. As of July 2021, the disease has caused the death of more than 4 million people worldwide, 600,000 in the US alone. While waiting for an effective vaccine amidst the surging cases worldwide, governments adopted measures to inhibit the spread of the disease. Despite these efforts, waves of COVID-19 infection with varying characteristics, continued to ravage communities [24], highlighting the necessity to understand the spatio-temporal complexity of the problem. Forecast models are among the tools available to public health experts and policymakers to predict likely pandemic outcomes (i.e., number of cases, deaths) and prepare for different scenarios. In the past year, several models have been proposed by a myriad of experts, and using vastly different assumptions, methodologies, parameters and data sources. As a result, models produce a range of sometimes radically different forecasts, especially at higher spatial resolutions, limiting their use by decision makers and the public in general. In order to address this problem, more recently, ensemble models have been proposed for COVID-19 forecasts, with promising results. Our research in this area has resulted in COVID-19 EnsembleVis, a web-based interactive visual interface that allows the assessment of the errors of ensembles and individual models by enabling users to effortlessly navigate through and compare the outputs of models considering their space and time dimensions. COVID-19 EnsembleVis enables a more detailed understanding of uncertainty and the range of forecasts generated by individual models.