
Visualizing Science: The OptIPuter Project
April 1st, 2009
Categories: Applications, Data Mining, Devices, Multimedia, Networking, Software, Supercomputing, Tele-Immersion, User Groups, Visualization, VR
Authors
Pieper, G., Leigh, J., Renambot, L., Verlo, A., Long, L., Brown, M., Sandin, D., Vishwanath, V., Kooima, R., Girado, J., Jeong, B., DeFanti, T., Liu, Q., Katz, M., Papadopoulos, P., Keefe, J., Hidley, G., Dawe, G., Kaufman, I., Glogowski, B., Doerr, K., et alAbout
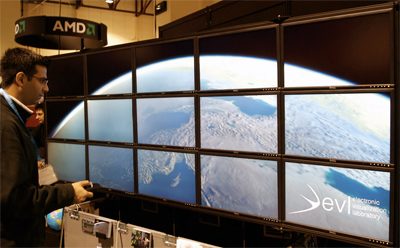
For many areas of science and engineering, visualization has become more than a convenient tool: it has become a necessity for interpreting the enormous amounts of data being produced by large-scale instrumentation, experiments and simulations. One of the most creative - and useful - ways of presenting scientific data is the large-scale tiled display. Ranging from tabletop versions to fully immersive 3D stereo virtual reality environments, these displays enable users to explore features that may be hard or impossible to identify with conventional, personal computers.
Concluding the first session of the SciDAC 2007 conference in Boston, SciDAC Program Director Dr. Michael Strayer commented that one of the major challenges facing the SciDAC multidisciplinary teams was “developing new visualization and data management systems to support moving, storing, analyzing, manipulating, and visualizing multipetabyes of scientific data and objects.”
Scientific visualization indeed has become a critical tool in understanding large datasets and the behavior of complex systems. And a special form of scientific visualization - large-scale tiled displays - is enabling scientists and engineers to explore a wide range of applications, from structural engineering of large buildings to medical studies of extremely small cellular structures.
Tiled displays are not new. During the early 1990s a number of planar tiled displays were built and used for scientific studies. Several factors limited their wide acceptance, however. They were expensive, large, and hence unsuitable for the typical office environment. To address this situation, the California Institute for Telecommunications and Information Technology (Calit2) at the University of California - San Diego (UCSD), and the Electronic Visualization Laboratory (EVL) at the University of Illinois - Chicago (UIC) initiated the OptIPuter project.
The goal of the OptIPuter project is to develop innovative methods for scientists to explore very large remote data objects in an interactive and collaborative fashion. It is an ambitious goal, and the developers have enjoyed remarkable success. Without a doubt the highlight is the “OptIPortal” - a commodity-priced, easily replicable display, with tens to hundreds of megapixels, which can be used by individual researchers or collaborative groups.
Resources
URL
Citation
Pieper, G., Leigh, J., Renambot, L., Verlo, A., Long, L., Brown, M., Sandin, D., Vishwanath, V., Kooima, R., Girado, J., Jeong, B., DeFanti, T., Liu, Q., Katz, M., Papadopoulos, P., Keefe, J., Hidley, G., Dawe, G., Kaufman, I., Glogowski, B., Doerr, K., et al, Visualizing Science: The OptIPuter Project, SciDAC Review, Issue 12, IOP Publishing in association with Argonne National Laboratory, Office of Science, pp. 32-41, for the US Department of Energy, April 1st, 2009. http://www.scidacreview.org/0902/html/optiputer.html